

Let’s take the kanban board. One of the things that the board does is to visualize the necessary interaction.
 Department A can not continue if Department B does not deliver its part of the discipline. A dependency at the level of line organization. Classic! So we visualize a map of the artefacts we need to deliver the promised value to the customer and ourselves (our value proposition). Furthermore, we visualize how it becomes valuable through our internal interaction in the first place! What we should NOT display is a chart of the organization. This is completely irrelevant for the added value. Value and nothing else is central to Kanban visualization.
Let’s assume we meet in front of the board at regular intervals. But what are people doing in front of this board? You could just put a representative of the trades somewhere in meetings! Where is the advantage? What is different? Let’s go back for a second. What happens when we put people in meetings? From my experience little to nothing. At least, this is the perception of the participants in 95% of cases of my advisory in 25 years of accumulated experience. Meetings are perceived as unnecessary overhead. Why is that? In my view, this is due to the lack of common grounds for discussion and knowledge about the overall state of the environment in which the actors are located. Simon Wardley uses the term situational awareness.
Typically, details of the discipline are exchanged at the technical level. Because this always excludes a part of those present, the question of what WE – and that is our added value – are doing next in the context of the appropriate altitude, is too little or rarely answered. Simply NOBODY does have the overview and everyone relies hierarchically on him/her established line organization representative.

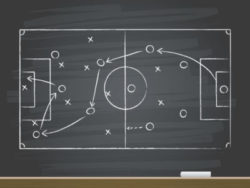
But what can the board do better at this point? Well, the board creates a space and a view in which we talk about the movement of concrete artefacts in the flow of value creation. These meetings are “exempt” from professionalism. This is important. It’s about tactical considerations. Shall we move the bishop to B2 or attack the proceeded tower of the opponent with the pawn. The goal is to establish an overall view. We also do not play chess with the visibility of a part of the board, do we?
Important at the thought of the map or the board is also the visualization of the change. Plan, Do, Study, Act, are the four phases of the Deming cycle. Whatever our loop interval is, one day, one week, one month, we want to know where we stand! We want to know where we are on the map right now after we have held the sextant to the sky. Iterative procedures have always been used in seafaring and the military. On a ship, everyone must always know where the overall “ship” system is, whether he/she is scrubbing the ground, setting the sails, cooking or being the captain. We can only positively influence a system if we know the overall state and always do!

Of course, that’s just the beginning. As a rule, the visualization also quickly reveals the surplus of simultaneous value increase expectations to capacity. The magic word here is predictability. This is mostly falling irrevocably by the wayside if the picture of the overall condition does not exist. How should it not? We can hardly know when we will be ready to fire our guns without this overall view – all of which are involved in creating it. It also does not help much to order from the top of the deck to load the cannons faster without creating the conditions for faster loading. Servant Leadership seems more appropriate here: “What do you need, dear gunners, so that you can fire the cannons on our signal as quickly as possible?”. So if we do not establish a culture in which we wait for the signal of the gunners, before we give the order to fire and do not constantly and continuously work on the value chain “firing”, we will lose the battle!
But why are most complex organizations slow? In Kanban Management we like to talk about work-in-progress or work-in-process of the system. Due to the missing overall view also the information (the signal) is missing where work is currently “ongoing”. This always leads to too much unfinished work remaining in the system and the system is simply too full.
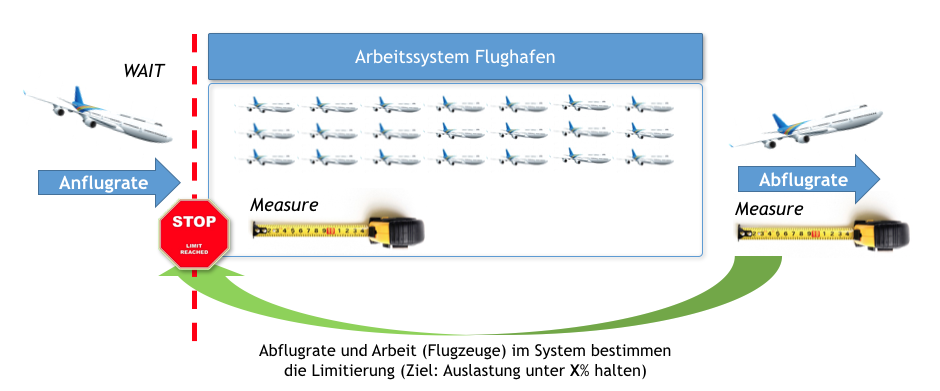
Imagine having an airport that is 100% busy. Consequently, no planes can land here. Airport operators know very well about the systemic problem of overloading/congestion, which does not start at 100% but already at around 85%. From this value on roughly, the queues and processing time become exponentially longer and longer. Aircraft approaching an airport must circle in the air until enough already landed aircraft have flown off. In terms of companies, this means that we must limit the inflow of to be completed measures, programs, initiatives, projects, work packages, etc., ie the WIP (Work In Process). This is only possible if we establish this capacity view at all levels of the company. Only then can the management steer in clear as well as stormy conditions. This is not about more comfortable working. This is about effectiveness versus efficiency. Efficient are most companies today. But are you effective too? And if so, how effective are you? Do you keep your value proposition promise? Do you consider yourself from the idea to the impact on the customer?
Visualization is a powerful weapon that receives far too little attention in modern companies
Let’s get back to the board again. Handing over the signal, I’m done with what I do, so that the information is stored in the system, is a key component of Kanban management. The board and the “signal cards” are the vehicle of information that is transmitted via the movement board visualization. Now you may say yes, that’s nice, but that’s not possible in our case. We have mini-small works or tasks from work packages or epics to subprojects to themes to projects or sagas to programs to initiatives to ideas, goals strategies. Right, that’s how we cut our added value most of the time. But do we look at value or organization? In my experience, too little is said about the value in this context. Organizations want to be slim. But this is only possible if you visualize where in the value chain “overhead” or “waste” hides that has no direct influence on value.
To come back to the starting point of the previous section, it is an effective means e.g. to take the enterprise’s value chain of an entire hierarchically lower levelled board into one process step of the board above it. We’re zooming out of the details of “implementation” because at tactical decision-making at the portfolio level, it’s only important when it starts and ends. In this way, the added value can be provided with different zoom levels.
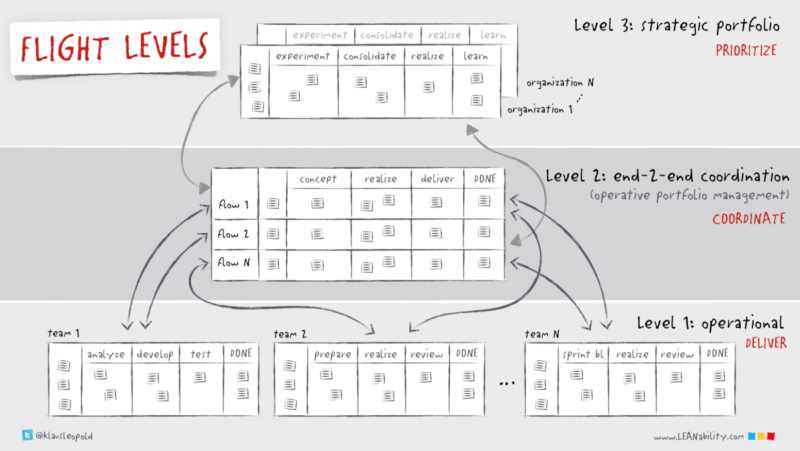
Dr Klaus Leopold talks about flight levels in this context (www.leanability.com/flight-levels). His analogy is that more or fewer details are exposed at different altitudes which one needs for tactical context-relevant decisions
At the end of the day, of course, the threads converge in corporate management. They specify the strategy for the overall system. How should the system behave? Where do we (the management) steer the ship “company”. Again, and especially here, the visualization, the signalling, the map, the vehicles on the map, all this is of decisive advantage. What would Napoleon have said if one of his generals reported to him that he could not yet say whether the battalion was already in position, or even more beautiful, Napoleon would not have had a map or board at which his executives had gathered to see the system “Battle” to review yesterday, today and tomorrow, and to introduce appropriate measures?